Are you need IT Support Engineer? Free Consultant

Alerts

Control Loop Performance Monitoring Solution

When change affects production performance, PlantESP keeps you in the know.

STAY INFORMED

Get Alerts When Change Affects Facility Performance

Production environments are complex and inherently dynamic. Change is not uncommon – in fact it’s the norm. Our PlantESP performance monitoring solution understands this and provides timely alerts when those changes affect your facility’s performance. By keeping you informed of changes, PlantESP allows you to direct resources effectively and efficiently.

stay informed

Benchmark Alerts

When you’re responsible for regulatory control at your production facility, knowing that a loop has shifted out of spec is important. Whether associated with the loop’s Overall Health, Oscillation, or another KPI, performance outside of design specifications can be detrimental to throughput and efficiency. PlantESP’s benchmark alerts keep you informed.

Alerts are an essential feature in any control loop performance monitoring utility. Our PlantESP performance monitoring solution allows users to activate the Alerts function on a loop-by-loop basis – activating them for all KPIs or for a more specialized set of metrics. Alerts can be configured by applying either user-defined or PlantESP-defined benchmarks. What’s more, PlantESP offers an optional feature that automatically tightens KPI benchmarks as individual loop performance improves over time.

stay informed

Troublemakers

Whether it’s a key loop that has degraded steadily over the past month or Stiction in a valve that’s doubled overnight, you need to be in the know. Change can undermine even the best control strategy and it can place plant-wide performance at risk. Our PlantESP performance monitoring solution maintains a constant watch for such ‘troublemakers’ so you can respond promptly.

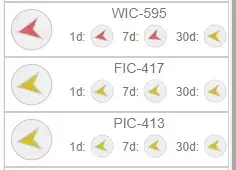
Troublemakers is an alerting protocol unique to PlantESP. It tracks the degree of change exhibited by each PID control loop within your production facility. Those loops that exhibit the most change over a span of 1-Day, 7-Days, and 30-Days are highlighted and the amount of change associated with each period is displayed on a loop-by-loop basis.

SUCCESS STORIES

What customers and partners are saying about Control Station

Let’s talk about

your project