Are you need IT Support Engineer? Free Consultant

System Health Monitoring

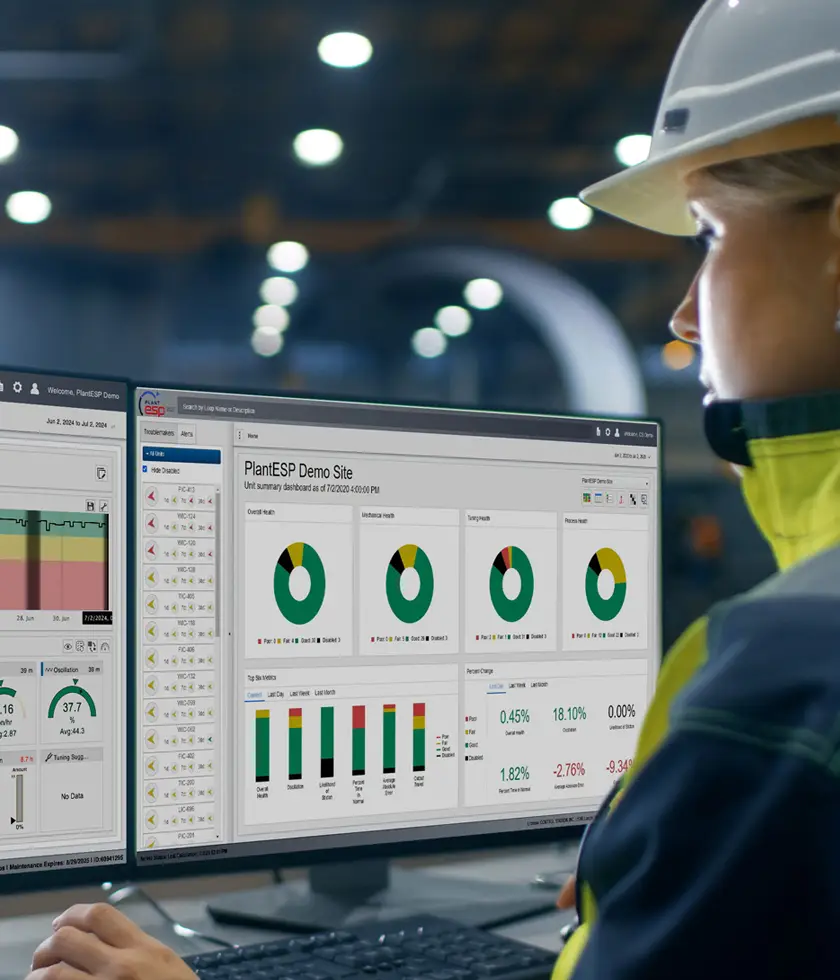
A service based on comprehensive data gathering, metrics, and analytics, and encompassing customers and processing plant facilities worldwide. Users can easily gain valuable data-driven insights from SHM, helping them promote world-class control strategies at their facilities.

3 Components of Health Monitoring:

Get Monthly Insights Into:

Server Health
Daily notification confirming the operational status of the PlantESP services, ensuring connectivity to the database, and indicating current calculation status (i.e., “Application Monitoring Service”).
OCE Analysis
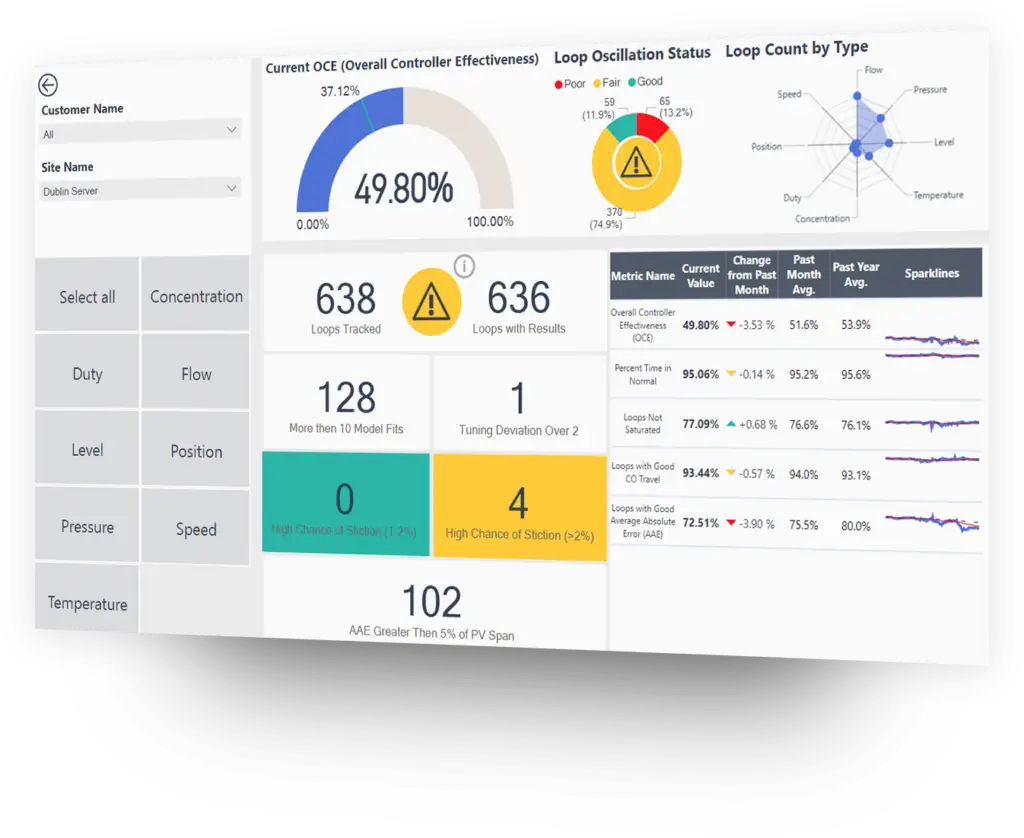
Using OCE, PID controllers of all variety can now be evaluated using a common rating scale. What’s more, the performance of multiple controllers within a unit operation, a plant, or an enterprise can be aggregated in a fashion that supports a variety of new benchmarking capabilities.
Aggregated Loop Behavior
An anonymized overview of control loop behavior across the PlantESP system. The aggregated data enables users to benchmark plant performance against other facilities.
System Health Monitoring

Key Benefits of System Health Monitoring​

System Health Monitoring

OCE (Overall Control Effectiveness)

OCE is a unique metric within PlantESP that assesses PID performance on a plantwide basis. Like OEE, it provides a singular measure that factors the availability, performance, and quality, and it enables the benchmarking of a facility’s performance over time.

Drive Continuous Plantwide Improvement
Focus attention and effort on select KPIs that drive performance
Achieve and Maintain World-Class Control
Track performance relative to documented industry benchmarks
Maximize the Return on Your Investment
Assure your regulatory control investments deliver maximal value
CONTROL STATION'S SOLUTIONS

Get Insights Into Your Plants Performance As It Relates To:​

Specific Site
The OCE at your site month over month
Multiple Sites
Compare the OCE across multiple sites within your organization
Your Plant vs. Industry
Compare your OCE versus the industry

Overview Of What System Health Monitoring Includes

  • System Health Monitoring
System Health Monitoring
-
Daily System Health Report
PlantESP System Surveillance:
PlantESP Configuration Scorecard:
Performance Scorecard - You vs Industry Averages:Monthly
OCE Performance Scorecard:Monthly
Virtual Project Results Review:Monthly
Monthly Scorecard of Top X Hit List:Top 3 - Monthly
Apply PlantESP Updates:
System Validation Assessment:
Identification of 3 PlantESP KPIs Matched to Business Goals:
Monthly List of Loops that Impact 3 PlantESP KPIs Matched to Business Goals:
Customized Project Charter:
Project Management and Reviews:
(Up to) # of Days Onsite:
Virtual Training PRIMERS:
Prioritized Action Plan:
Valve Performance Analysis:
Control Strategy Recommendations:
Documentation of Business Results:
Annual Review with Dr. Bob Rice:
Get A Quote
About Company

What SHM Services Include

Daily System Health Report
A daily report generated by the PlantESP system that provides a summary of the system’s operations over the past 24 hours. This report is automatically emailed to the customer to ensure they are kept informed of the system's performance, including any alerts, operational metrics, or issues that occurred.
PlantESP System Surveillance
Integrating the monitoring of the system into PlantESP's overall surveillance framework. This step ensures continuous monitoring to verify that the system is operational and performing optimally, identifying any potential downtime or anomalies.
PlantESP Configuration Scorecard
A detailed report that assesses the current configuration of the PlantESP system against best practices and industry standards. This scorecard highlights areas where the system configuration may need adjustments or improvements to optimize performance.
Performance Scorecard - You vs Industry Averages:
Integrating the monitoring of the system into PlantESP's overall surveillance framework. This step ensures continuous monitoring to verify that the system is operational and performing optimally, identifying any potential downtime or anomalies.
OCE Performance Scorecard
OCE (Overall Control Effectiveness) is a metric used to evaluate the effectiveness of the control strategies implemented by the PlantESP system. This evaluation assesses how well the system is maintaining desired process conditions and minimizing variability.
Virtual Project Results Review
A virtual meeting or session where the results of a specific project are reviewed with the customer. This review typically includes a discussion of the project objectives, outcomes, challenges, and recommendations for future actions.
Apply PlantESP Updates
The process of updating the PlantESP system with the latest software patches, enhancements, or configuration changes. Control Station will install the patches when they become available, notifying the customer of the update and providing them with the option to proceed. This ensures that the system remains up-to-date with the latest features and security improvements.
Monthly Scorecard of Top X Hit List
A monthly report that ranks the top X issues or performance hits identified by the PlantESP system. This report helps prioritize which issues should be addressed first based on their impact on system performance or OCE.
CONTROL STATION'S SOLUTIONS

Our Products & Services Help You Achieve Your Process Control Goals.

PlantESP
MONITORING
PlantESP
PlantESP proactively monitors control loop performance on a plant-wide basis.
LOOP-PRO
TUNING
LOOP-PRO
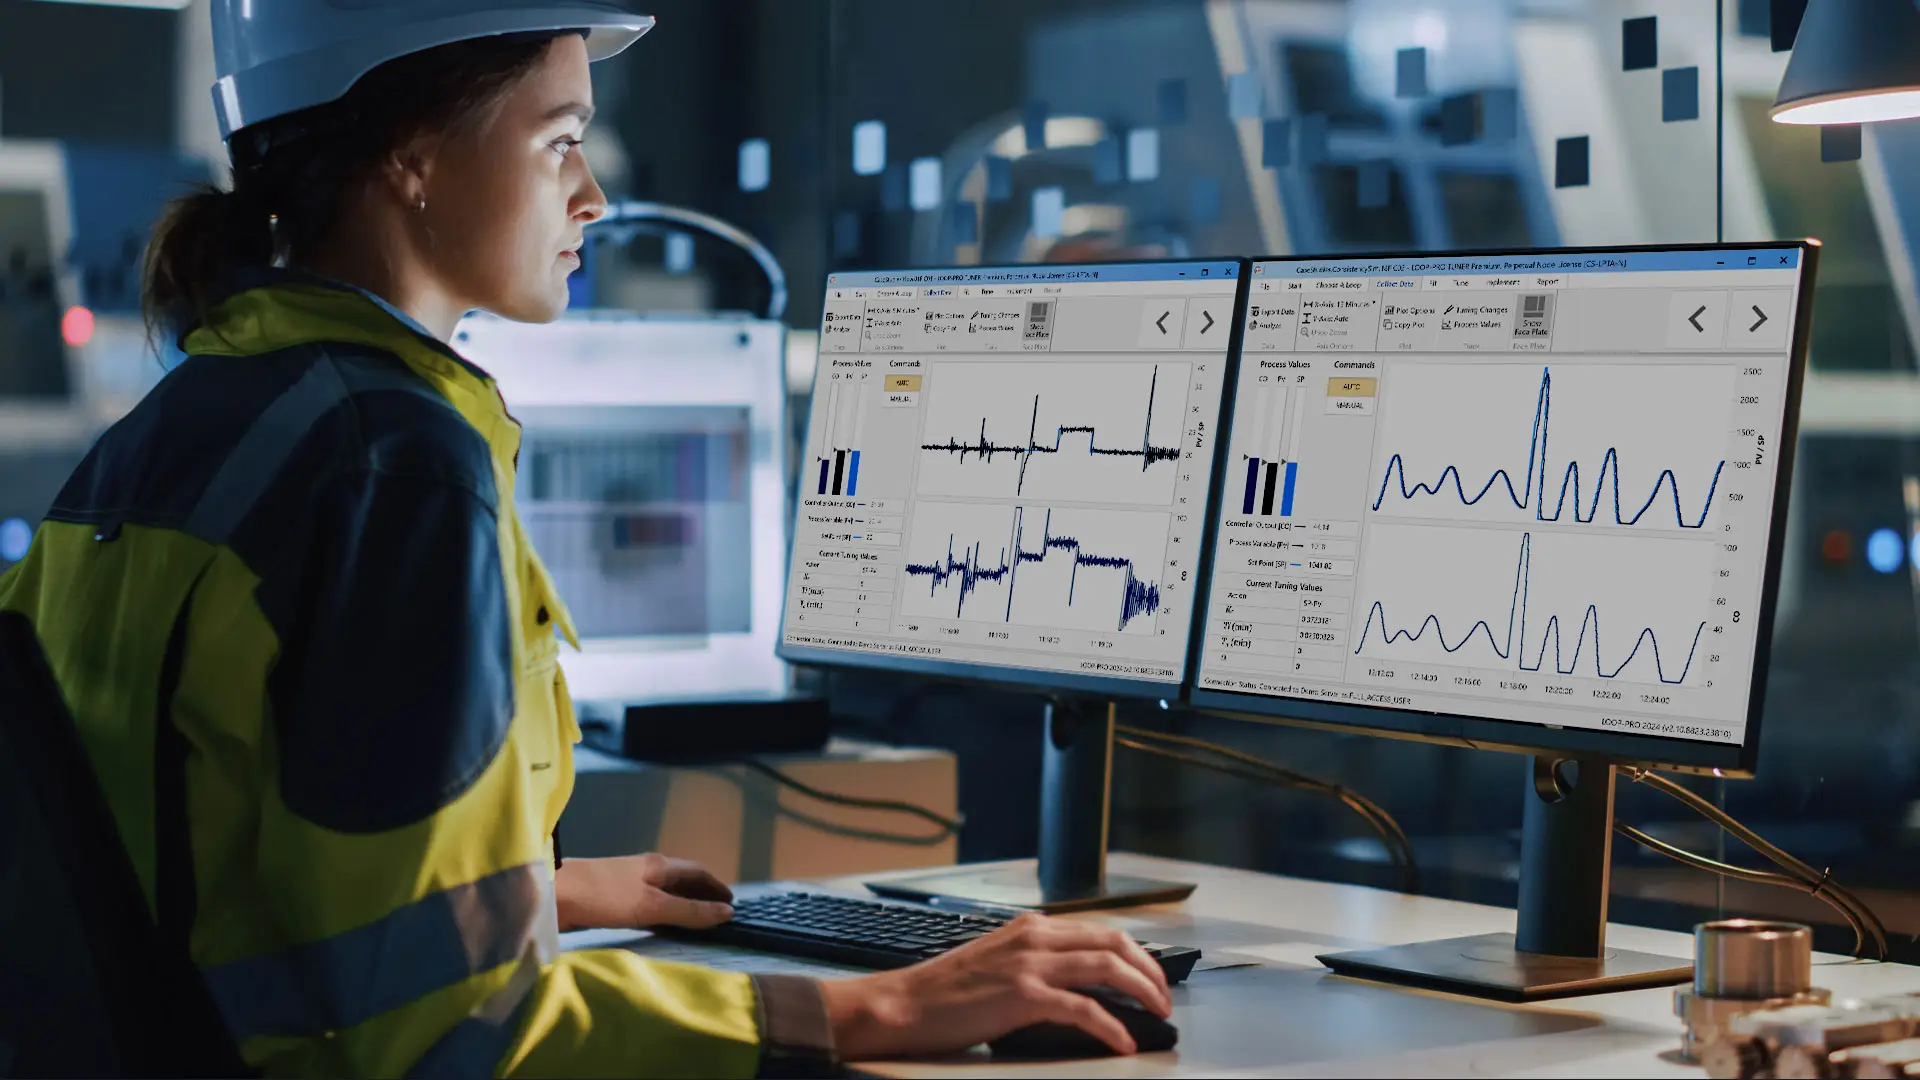
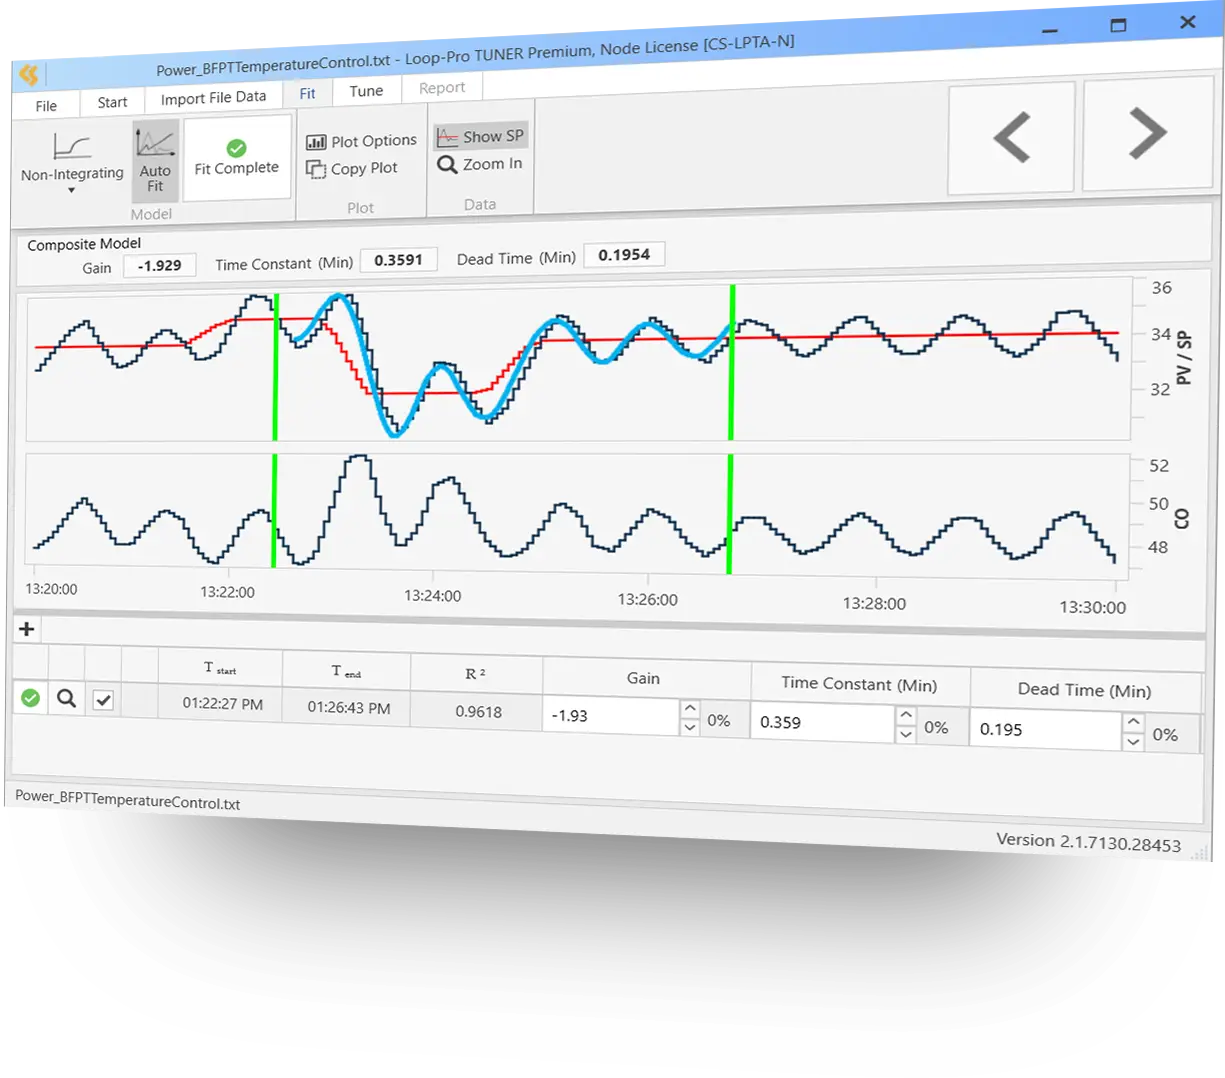
tune your facility’s most dynamic and challenging PID control loops for optimal performance.
LIFECYCLE SOLUTIONS
SERVICES
LIFECYCLE SOLUTIONS
We work with you to fill in the staffing gaps, skills, experience and tools.

Let’s talk about

your project